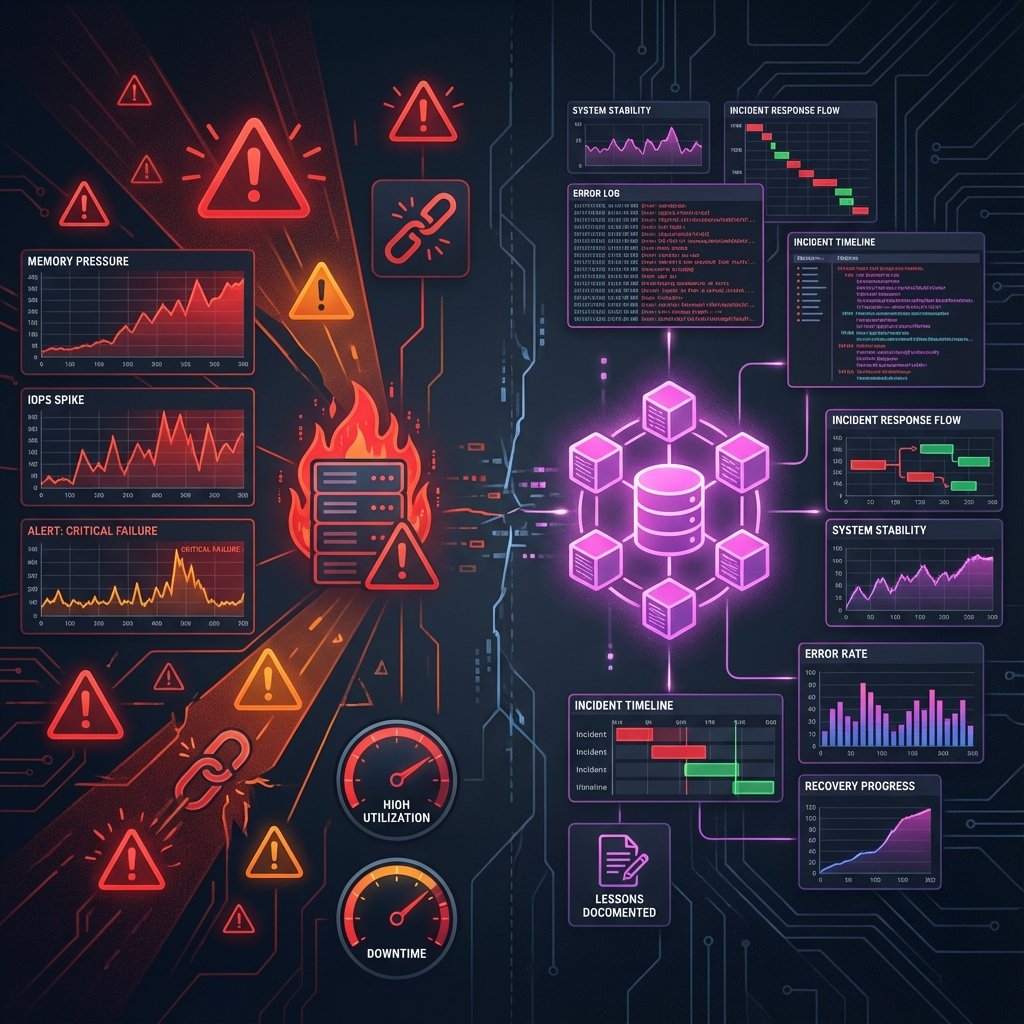
Lessons Learned Running SingleStore in Production (The Painful Ones)
Real failure modes, operational mistakes, and hard-learned lessons from running a distributed HTAP system at scale. No marketing, just engineering.
[!NOTE] This post is Part 4 of the Distributed SQL Deep Dive series.
After two years supporting production SingleStore clusters—from 3-node dev environments to 40-node monsters processing 500K TPS—I've learned that most outages start with confident assumptions. This post covers the mistakes that hurt.
TL;DR
- Memory isn't optional—it's the hard requirement that determines everything else
- Query patterns matter more than hardware—one bad JOIN reshuffles terabytes across your network
- HTAP means shared resource contention—analytics and OLTP fight for the same CPU/IO
- Schema changes are deployment events—not DBA tasks
- High availability requires active-active—passive standby is an expensive lie
- Distributed systems fail sideways—the symptom appears nowhere near the cause
If you're evaluating HTAP databases, this post explains what the vendor won't tell you.
Memory: The Requirement Everyone Treats as an Optimization
This is the mistake that cost us the most money.
We sized our first production cluster based on data size. We had 2TB of active data, so we provisioned 3TB of storage with 128GB RAM per node. Math seemed fine.
We were consistently OOM within 48 hours.
Why Memory Is Non-Negotiable
SingleStore (and most columnar stores) aren't like PostgreSQL. You can't just swap to disk when memory runs out. Here's what actually happens:
The rowstore (transactional data) needs memory for:
- Active transactions
- MVCC versioning
- Index pages
- Lock tables
The columnstore (analytical data) needs memory for:
- Segment decompression
- Hash table builds during aggregations
- Sort buffers
- Result sets
Background merges consolidate small segments into larger ones. If they run out of memory, they spill to disk. This is 2-5x slower and creates cascade failures during heavy write periods.
Replication doubles memory pressure because you're holding:
- Original data in memory
- Replicated data being written
- Replication log entries
The Incident
What happened:
Our dashboard query ran every 5 minutes:
sqlSELECT user_id, COUNT(*), SUM(amount)
FROM orders
WHERE created_at > NOW() - INTERVAL 1 HOUR
GROUP BY user_id;
Simple query. On PostgreSQL, this would be 100ms.
On SingleStore, during peak traffic:
- Query needs to decompress ~500MB of columnstore segments
- Build hash table for 2M unique users
- Aggregate across 8 leaf nodes
- Merge results on aggregator
Memory required: ~12GB per query.
We had 10 concurrent dashboards running this query.
Result: OOM kills, node restarts, cluster instability.
What We Did Wrong
- Sized for data, not workload
- Didn't account for query memory amplification
- Ignored background process overhead
- Ran OLTP and OLAP on the same memory pool
What We Should Have Done
Memory sizing formula:
textTotal Memory = (Data * 0.3) + (Peak Query Concurrency * Max Query Memory) + (Write Buffer * 2) + 20% safety
For our workload:
- Data: 2TB
- Peak queries: 20
- Max query memory: 8GB
- Write buffer: 50GB
Required: 600GB + 160GB + 100GB + 150GB = ~1TB RAM
We had 384GB total (128GB × 3 nodes).
We were off by 3x.
Query Patterns That Quietly Destroy Performance
The second-hardest lesson: SingleStore's query planner doesn't save you from yourself.
The Distributed JOIN That Killed Us
sql-- Looks innocent
SELECT u.email, o.order_count, o.total_revenue
FROM users u
JOIN (
SELECT user_id, COUNT(*) as order_count, SUM(amount) as total_revenue
FROM orders
WHERE created_at > '2025-01-01'
GROUP BY user_id
) o ON u.user_id = o.user_id
WHERE u.status = 'active';
On a single-node database, this is fine.
On a distributed system:
Total data movement: 2.8GB
For a query that returns 50KB of results.
What Went Wrong
The users table (200MB, rowstore) got broadcast to all leaf nodes because it wasn't sharded on user_id.
The fix:
sql-- Shard users table on user_id
ALTER TABLE users SHARD KEY (user_id);
After this change:
- No broadcast
- Co-located joins
- Network transfer: <1MB
Query time: 12 seconds → 200ms
The Pattern
Bad: Join tables with mismatched shard keys
Good: Co-locate data by the JOIN column
Bad: GROUP BY high-cardinality column (user_id)
Good: Pre-aggregate or use columnar indexes
Bad: SELECT * in distributed queries
Good: Explicit column selection
Ingest + Analytics Contention (Or: Why Your Dashboard Killed Your API)
HTAP promises you can run analytics without hurting OLTP.
This is true—until it isn't.
The Incident: Analytics Contention
Context:
E-commerce platform. Black Friday. Peak traffic: 50K writes/sec.
What we did:
Launched a real-time fraud dashboard powered by a complex analytical query that ran every 30 seconds.
What happened:
- Dashboard query scans 500M rows
- CPU spikes to 95% across all leaf nodes
- Rowstore writes slow down (P99: 5ms → 50ms)
- Application timeouts start
- Connection pool exhausts
- API unavailable
Duration: 22 minutes
Root Cause
The fraud query was I/O bound, reading gigabytes of columnstore data.
This saturated disk I/O, causing:
- Rowstore writes to queue
- WAL fsync to slow down
- Transaction latency to spike
We had three workloads fighting for the same disk:
- Transactional writes (critical)
- Analytical scans (optional)
- Background merges (necessary)
There was no resource isolation.
The Fix
Short term:
- Moved dashboard to read replica
- Added query timeout (30s max)
- Implemented query queue limits
Long term:
- Separate OLTP and OLAP clusters
- Replicate data from OLTP to OLAP
- Accept seconds of lag for analytics
Lesson: HTAP works until your workloads spike simultaneously. Then you need separation.
Schema Changes: The Operational Blind Spot
In PostgreSQL, ALTER TABLE is a DBA task.
In a distributed database, it's a deployment event.
What We Learned
Adding a column to a 1TB table:
sqlALTER TABLE orders ADD COLUMN affiliate_id INT;
Expected: Metadata update, instant
Actual: 6-hour cluster lock, production outage
Why It Broke
- Rowstore compaction triggered—rearranging rows for new column
- Columnstore segments rebuilt—all 1TB re-encoded
- Replication backlog exploded—every node replicating schema change
- Queries queued—table locked during rebuild
- Connection pool exhausted—timeouts cascaded
The Pattern (Schema Changes: The Operational Blind Spot)
Schema changes in distributed systems:
- Touch every partition
- Require inter-node coordination
- Block concurrent writes
- Amplify network traffic
What We Do Now
1. Add columns as nullable
sql-- Bad: NOT NULL requires default value fill
ALTER TABLE orders ADD COLUMN status VARCHAR(20) NOT NULL DEFAULT 'pending';
-- Good: Nullable, backfill separately
ALTER TABLE orders ADD COLUMN status VARCHAR(20);
-- Backfill in batches, off-peak
UPDATE orders SET status = 'pending' WHERE status IS NULL LIMIT 100000;
2. Test on read replica first
3. Schedule during maintenance windows
4. Monitor replication lag
5. Have rollback plan
High Availability: Myths vs Reality
Myth: "We have replication, so we're highly available."
Reality: Passive replicas are disaster recovery, not high availability.
The Failure Mode Nobody Expects
Setup:
- 3-node cluster
- Synchronous replication
- "5 nines" SLA from vendor
Incident:
- Primary leaf node fails (disk corruption)
- Automatic failover to replica
- Failover time: 45 seconds
For a system doing 50K TPS, 45 seconds = 2.25 million failed requests.
Why Failover Is Slow
- Failure detection: 10-15 seconds—heartbeat timeout
- Leader election: 5-10 seconds—raft consensus
- State reconciliation: 10-15 seconds—apply pending WAL
- Connection re-routing: 5-10 seconds—clients reconnect
This is optimistic. In practice, we saw 60-90 second failovers.
What Actually Works
Active-active with client-side routing:
textApp → Load Balancer → [Node 1, Node 2, Node 3] ↓ ↓ ↓ All nodes accept writes
Trade-off: More complex conflict resolution, but zero failover time.
Our choice: Accept passive replication, set client timeout to 60 seconds, implement retry logic.
Distributed Systems Fail Sideways
The hardest debugging lesson: the symptom appears nowhere near the cause.
Real Incident
Alert: "API response time P99 > 1 second"
Investigation:
- Check API servers: Normal
- Check database: Queries slow on Leaf 3
- Check Leaf 3 metrics: Disk I/O saturation
- Check what's hitting Leaf 3: Nothing unusual
Root cause (found 2 hours later):
Batch job on Leaf 1 caused replication lag → Leaf 3 caught up → disk I/O spiked → queries slowed.
The alert happened on the application. The root cause was a batch job on a different node.
The Pattern: Distributed Failures
In distributed systems:
- Cause and effect are decoupled in time
- Cause and effect are decoupled in space
- Monitoring must be cluster-wide, not node-centric
What We Monitor Now
Not just:
- CPU, memory, disk per node
But also:
- Replication lag between nodes
- Query latency by shard
- Network saturation between nodes
- Background process backlog
- Memory pressure trends (leading indicator)
The Diagram I Wish I'd Drawn Earlier
This is the mental model that would have saved us months of pain:
Key insight: Everything shares everything. When one workload spikes, everything else suffers.
What I'd Do Differently Next Time
1. Size for Memory, Not Data
Use this formula:
textMemory = (Active Data × 0.3) + (Query Working Sets × Concurrency) + 30% overhead
Don't cheap out. If the math says 512GB, provision 768GB.
2. Separate OLTP and OLAP Early
Don't wait for production pain.
Start with:
- OLTP cluster (rowstore-heavy, small nodes, many replicas)
- OLAP cluster (columnstore-heavy, large nodes, read replicas)
- Real-time replication between them
Accept seconds of lag for analytics.
3. Shard Keys Are Schema Decisions
Shard key is the most important schema choice. It determines:
- Query performance
- Data distribution
- Operational complexity
Choose carefully. Changing it later requires full data migration.
4. Treat Schema Changes as Deployments
Schema migration process:
- Test on replica
- Measure time and resource impact
- Schedule maintenance window
- Monitor replication lag
- Have rollback plan
5. Monitor Leading Indicators
Don't wait for alerts. Watch:
- Memory pressure trends (before OOM)
- Replication lag growth (before divergence)
- Segment merge backlog (before compaction stall)
6. Load Test for Failure, Not Capacity
Don't just test "can it handle 100K TPS?"
Test:
- What happens when one workload spikes?
- What happens during failover?
- What happens when memory is 90% full?
- What happens during schema changes?
Final Takeaway
Running distributed databases in production isn't about knowing the features.
It's about knowing the failure modes.
SingleStore is a powerful system. But power without understanding leads to expensive mistakes.
The real lesson: Respect the complexity. Test the assumptions. Monitor the second-order effects.
And always, always size for memory.
Further Reading
- SingleStore vs PostgreSQL: When Distributed SQL Actually Wins
- How SingleStore Handles Real-Time Analytics at Scale
- Debugging Slow Database Queries
Have your own production war stories? I'd love to hear them. Email me or connect on LinkedIn.

About the Author
Shahid Moosa is a Cloud Database Support Engineer specializing in distributed systems, AWS, and SingleStore. He helps teams build scalable, reliable data infrastructure.
Get in touch →Share this briefing
Related Posts
Why HTAP Systems Fail Quietly (And How to Notice Early)
HTAP systems don't fail with a bang; they fail sideways through memory contention and silent performance drift. Learn why mixed workloads are a silent production risk.
Distributed SQL Deep Dive: A 5-Part Series
A guided journey through the architecture, performance, and operational reality of HTAP and distributed SQL systems.
How SingleStore Handles Real-Time Analytics at Scale (Without the Fairy Dust)
An honest look at how HTAP databases actually work in production—the architecture, trade-offs, and when you shouldn't use them.